TableMaster (Data Grid)
The TableMaster is the central table component in calServer v2. It is used on all list pages and offers extensive features for data viewing, filtering, and configuration.
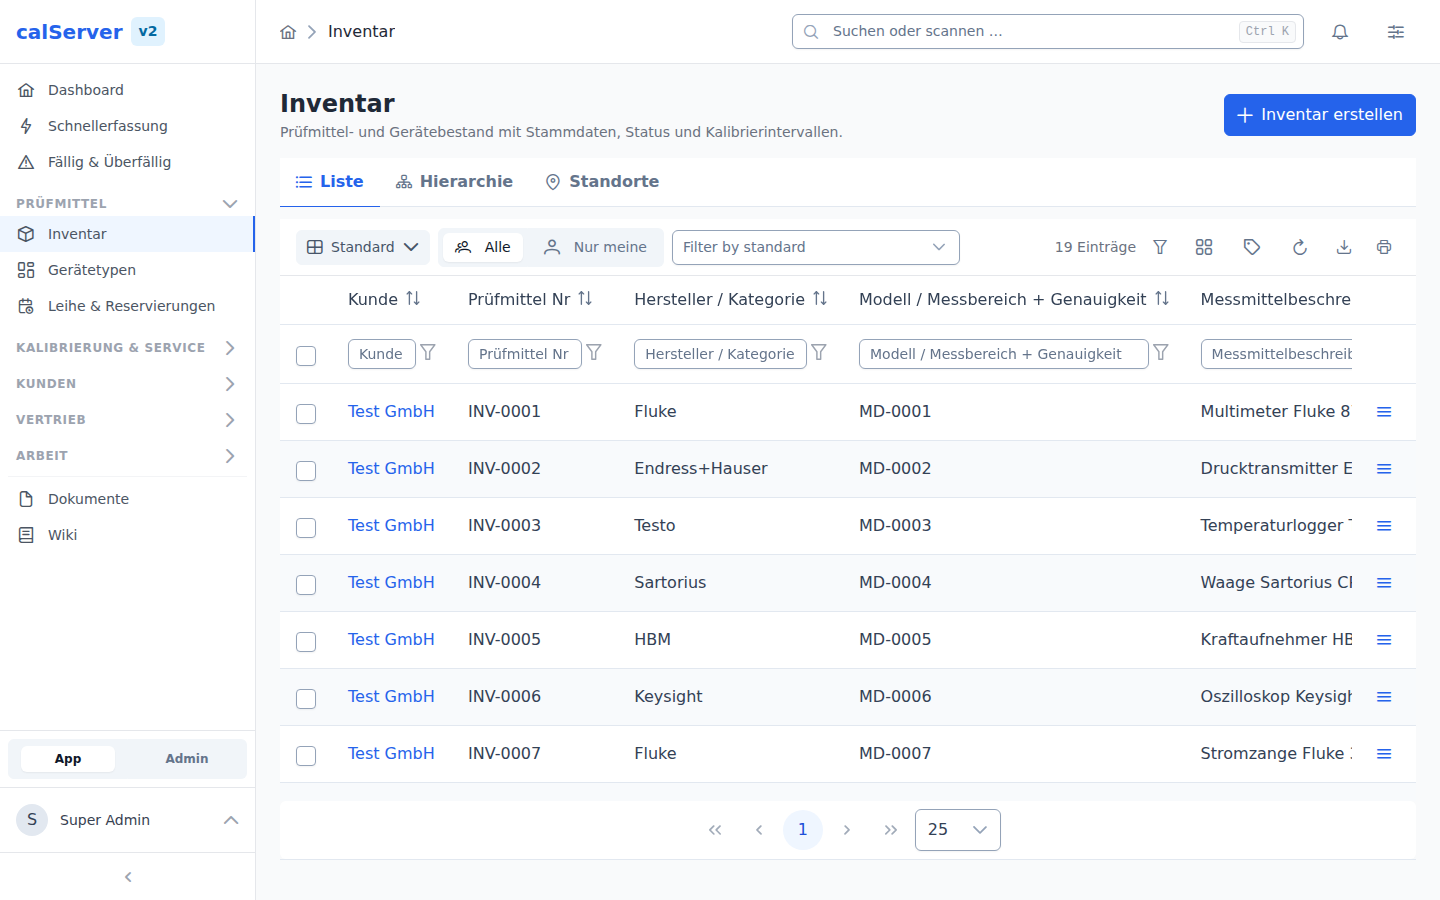
Structure
The TableMaster consists of the following areas:
| Area | Description |
|---|---|
| Toolbar | Action buttons (New, Export, Filter, Column Chooser) |
| Column Headers | Sortable by click, with filter row below |
| Data Area | Table rows with row actions |
| Footer | Pagination and rows-per-page selection |
Column Chooser
The Column Chooser button in the toolbar lets you configure which columns are displayed:
- All available fields of the resource are listed
- Columns can be shown/hidden via checkboxes
- The order can be adjusted via drag and drop
- Settings are saved per user
Grid Templates
Administrators can define standard column layouts via Grid Templates that serve as a starting point for all users of a given role.
New columns
A saved column layout is a snapshot: it holds exactly the columns that were selected when it was saved, and it takes precedence over template and factory default. So a field added later — even one that belongs to the default columns — can never show up in that layout. It is not hidden, it simply is not in the list.
To keep that from going unnoticed, the grid reports "New columns available" above the table and names them. Two ways, one click each:
- Show adds the columns to your layout.
- Hide leaves the layout as it is.
Both save, so the message is answered and does not come back.
Columns you deselected yourself never appear here. calServer records for every layout which default columns existed when it was saved, and reports only what has been added since.
Links in the table: two kinds, two targets
A row carries two kinds of links, and they lead to different places:
| Kind | Appearance | Target |
|---|---|---|
| Row link | coloured, emphasised, no symbol | the record of this row |
| Value link | normal text colour with an arrow ↗ | another record the row points at |
The rule behind it: exactly one value per row is coloured, and it always opens the row itself. Anything with an arrow leads elsewhere.
Row link
The row link sits on the row's key value — the asset number in the inventory, the order number for orders, the certificate number for calibrations. When that field is hidden in the current view, the link moves to the first shown column holding a value of the row itself.
The previous ways stay: double-clicking the row and the arrow button on the right edge open the same detail page.
Value link
Columns pointing at another record — customer, device type, price group, location — are clickable too and lead straight to its detail page. That saves the detour through the other grid and the search for the name you are already looking at. The arrow ↗ behind the value marks them.
The reason for the split: whoever moves the customer to the front — common in inventory and order lists — used to have the link leading away from the row as the only visible one in it. A click on "Muster GmbH" landed on the customer when the device was meant. Colour and symbol now say where a click goes before you make it.
A reference is only linked when both hold: a detail page exists, and your role may open it. Without either, the name stays plain text — a link that leads to "no permission" would be an offer that is none.
Filtering
Column Filters
Directly below the column headers are input fields for quick filtering:
- Text fields filter by partial match (LIKE). Wildcards:
*stands for any number of characters,?for exactly one. Match case turns on the distinction per column; it applies to "contains", "does not contain", "starts with" and "ends with" — "equals" always compares exactly. - Date fields offer range selection
- Status fields offer dropdown selection
- Category columns offer an expandable tree with checkboxes: several categories can be ticked together, and a parent category includes everything below it (see Categories)
- Filters are applied immediately (debounced)
Advanced Filters
The Advanced Filter Dialog (TmAdvancedFilterDialog) enables complex filter logic:
- Multiple conditions with AND/OR operators
- Various operators: equals, not equals, contains, starts with, greater than, less than, between
- Text comparisons as in the column filter: wildcards
*and?, plus match case per condition (shown for "contains", "does not contain", "starts with" and "ends with") - Filters can be saved and reused later
- Saved filters are also usable as dashboard widgets
Filter Panel
The TmAdvancedFilterPanel displays active filters as chips. Clicking a chip removes the filter.
Taking the column filters into the formula
What is set up in the table does not have to be typed again in the formula editor. Two ways get it there:
- In the filter panel, "Create a filter from the current column filters" (the icon next to the plus, shown only while column filters are set) opens a new filter that already carries every condition — all that is left is the name.
- In the open dialog, "Take over grid filters" does the same. The menu next to it appends them to an existing formula with AND instead of replacing it.
Whatever the formula can express is carried over: text, number, date, choice and yes/no conditions, including a column's multiple conditions and their AND/OR join. Several columns are joined with AND — exactly as in the table.
The dialog then reports what came over and what did not. Left out are:
- Category filters "incl. subcategories" — the formula language has no subtree operator. Spelled out as a list, a subcategory created later would silently drop out of the saved filter. To get the category into the formula anyway, set the column filter to "is" first.
- Values containing an apostrophe and values that do not fit the field type (text in a numeric column).
- Fields the filter type does not know, and deactivated fields.
The column filter's match case setting and the wildcards * and ? come
along: the resulting formula matches the same rows as the column filter.
Text comparisons in the formula (text mode)
In Formula (text) mode a text comparison is written with LIKE:
| Formula | Meaning |
|---|---|
manufacturer LIKE '%Fluke%' |
contains "Fluke", case ignored |
manufacturer LIKE BINARY '%Fluke%' |
contains "Fluke" in exactly this case |
manufacturer NOT LIKE BINARY '%Fluke%' |
does not contain "Fluke" in this case |
asset_number LIKE 'KAL!_%' |
starts with "KAL_" (literal underscore) |
In the formula the wildcards are % (any number of characters) and _
(exactly one); the visual editor shows them as * and ?. A ! in front
makes %, _ or ! an ordinary character.
Changed in October 2026
A text comparison in a formula used to depend on the database: case
sensitive on PostgreSQL, case insensitive on MySQL and SQL Server. It now
ignores case everywhere unless the condition carries BINARY. A saved
filter with _ in its search value now shows that wildcard as ? in the
visual editor — it has always filtered that way.
Dates are frozen
A column filter holds a concrete date ("last 30 days" became two dates when
it was set), and those are what end up in the formula. For a filter that
moves with time, switch to a date variable in the editor (Today, start of
month, …) — this is where a saved filter can do more than a column filter.
Saving as statistic
A saved filter can record its result count at fixed reference dates, for example "number of overdue devices at month end". In the dialog, under "Save as statistic", pick one or more kinds of reference date:
| Period | Start | End |
|---|---|---|
| Day | 00:00 of the day | last state of the day |
| Week (Monday to Sunday) | Monday | Sunday |
| Month | first of the month | last of the month |
| Quarter | 1 Jan, 1 Apr, 1 Jul, 1 Oct | 31 Mar, 30 Jun, 30 Sep, 31 Dec |
| Year | 1 Jan | 31 Dec |
Each reference date is counted once, shortly after midnight, and the value is
never changed afterwards. Date variables in the formula (Today, start of
month, …) refer to the reference date, not to the day of counting: for
"Month, end", "Today" is the last day of the month, even though the count runs
on the first of the next one. Day boundaries follow the time zone of the
scheduled task Save filter statistics (otherwise the installation's).
The first value appears at the next reference date. If the server was down on a reference date, it catches up only the latest missed value and marks it as "counted late"; older gaps stay empty in the chart instead of showing 0.
Recompute history: on a saved filter, the dialog fills past reference
dates of a range from today's data. This only works when the formula uses
a date variable such as Today; otherwise every recomputed value would be
today's state. What was actually in stock back then is unknown to the
recomputation: a device deleted in the meantime is missing retroactively too.
Existing values are left untouched, recomputed ones are marked in the chart.
The recomputation runs in the background.
The values are shown by the dashboard tile Filter statistic.
Changed in October 2026
The setting used to be "Interval (days)" with a start date, and counting ran hourly, overwriting the day's value. Existing settings are carried over (an interval becomes "Day, end"), as are the values collected in V1.
Sharing a filter with roles
A saved filter is private at first. Users holding the "Share Advanced
Filters" permission (advanced_filter_share) get a share icon on their own
filters in the panel and can hand them out:
- to individual roles — every member of those roles sees the filter in their own filter list;
- to every user (system filter).
That is what lets a role view or a dashboard template carry the filter it points at. Without the share, the template leaves it out and a dashboard tile naming it stays empty for the recipient.
The formula is shared, not the data
A shared filter only hands out its conditions. Every recipient still counts and filters across the records they are allowed to see — their customer scope is untouched. Two users can therefore get different numbers from the same filter. The statistic is the exception: it is counted once per reference date with the permissions of the filter's owner, and everyone sees the same values.
While a filter is shared, other people's views and tiles depend on it. Editing and deleting it therefore require the same permission as sharing it; without it the filter stays usable but unchangeable. Revoke sharing makes it private again — the tiles of its former recipients then show nothing.
Sorting
- Simple sorting: Clicking a column header toggles between ascending, descending, and no sorting
- Sort direction is indicated by an arrow in the column header
Export
Data can be exported via the Export button in the toolbar:
| Format | Description |
|---|---|
| Excel (XLSX) | Export as Excel file with all visible columns |
| CSV | Export as CSV file |
- The currently filtered data is exported
- The column selection matches the current grid view
- Large datasets are processed server-side
Printing
The Print button in the toolbar opens the print view in a new tab and starts the print dialog once the data has loaded.
- What gets printed is the current view: column filters, advanced filter, sorting, "only mine / all" and the page's own restriction (e.g. the due bucket under "Due & Overdue") are carried over
- The columns match the grid view, in their order
- Output starts at row 1 (not at the page currently displayed) and is capped at 500 rows
Truncated printouts
When the view holds more rows than are printed, the print header says so ("Gekürzt: … von … Zeilen"). Use the export for the complete dataset.
Pagination
- Default: 25 rows per page
- Configurable: 10, 25, 50, 100 rows
- Navigation: First, Previous, Next, Last page
- Display of total number of entries
Selection and bulk actions
As soon as a grid offers an action that works on a selection — bulk actions or master reports — it gets a checkbox column. After marking rows, the action buttons appear on the left of the toolbar ("n selected"):
| Action | Description | Example permission |
|---|---|---|
| Delete | Deletes the marked entries after confirmation (server-side bulk endpoint; dependent entries are skipped and reported) | inventory_delete |
| Export | Exports the resource as CSV | inventory_view |
| Location/Loan | Inventory only: creates a new location/loan entry per marked device — see loan equipment | location_edit |
| Reports | Runs configured master reports for the selection (only shown when reports are configured for the grid) | report visibility |
As in calServer v1, every button is bound to an operation: bulk actions and action columns are only shown when the user's role contains the respective operation. The complete catalog of all v1 grid buttons with their operations and v2 status is documented in the V1 grid buttons catalog.
Reports in the grid
Grids with configured reports (inventory, calibration, orders, repairs, locations) show:
- "Reports" toolbar button with an active selection: master reports for all marked rows, incl. report picker and a single prompt for runtime parameters
- Per-row report menu (PDF icon): detail reports, "print label", "direct print" and "file to DMS"
Which buttons appear is controlled entirely by the report administration (grid placement, role/group visibility) — nothing is configured in the grid itself.
Files in the grid
Grids with DMS presence (inventory, calibration, orders, repairs) show a paperclip action per row: the dialog lists the row's documents grouped by file category (name, version, release status) with download and direct versioned upload (re-uploading the same category bumps the version). Who sees unreleased versions is governed by the role/group rules of the file administration.
Row Actions
Each row offers an action menu (depending on permissions):
| Action | Description |
|---|---|
| View | Opens the detail view |
| Edit | Opens the edit form |
| Duplicate | Creates a copy as a new entry |
| Delete | Deletes the entry after confirmation |
Permissions
Actions are only displayed if the user has the corresponding permission (e.g., inventory_edit for editing, inventory_delete for deleting). The server additionally checks every action independent of the displayed button.