Dashboard
The dashboard is the start page of calServer v2 (/v2/). It provides a configurable overview with widgets that can be arranged via drag and drop.
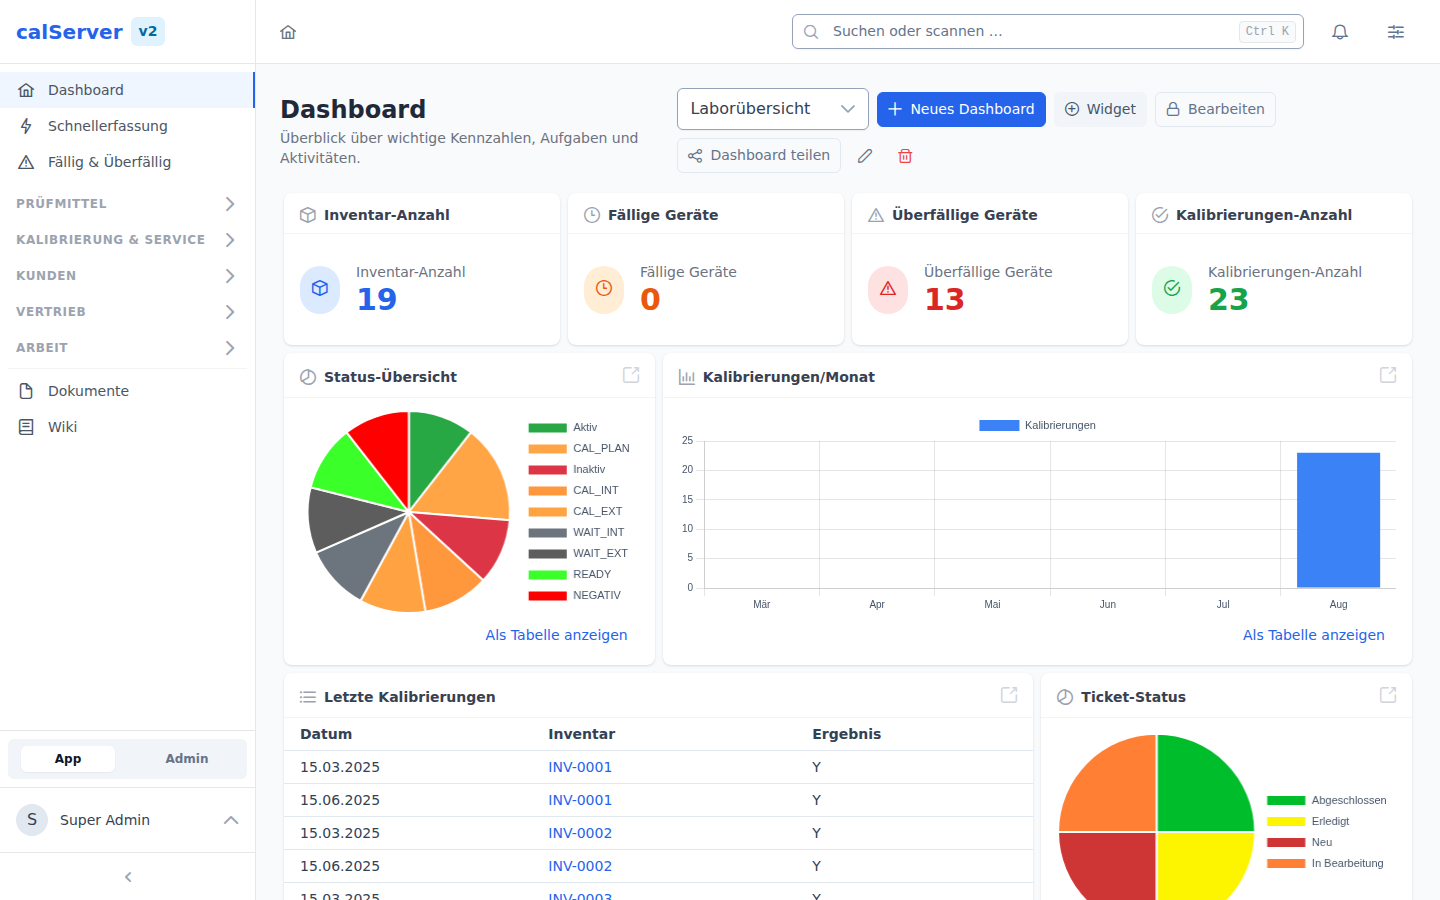
Structure
The dashboard is based on a grid layout (gridstack) that is freely configurable:
- Widgets can be positioned via drag and drop
- The size of each widget is freely scalable
- The layout is saved per user
- Multiple dashboards can be created
Widget Catalog
The Add Widget button opens the widget catalog with the following widget types:
Counter Widget (CountWidget)
Displays a single metric as a large number:
- Based on a saved filter
- Shows the number of results
- Color-configurable
- Ideal for KPIs such as "Overdue Calibrations" or "Open Repairs"
Chart Widget (ChartWidget)
Displays data as a Chart.js chart:
- Supported types: bar, line, pie, doughnut
- Data source: saved filters or status distributions
- Time series display available
- Interactive: hover shows detail values
Table Widget (TableWidget)
Displays a compact data table:
- Based on a saved filter
- Configurable column selection
- Shows the most important fields at a glance
- Clicking a row opens the detail view
Advanced Filter Count Widget (AdvancedFilterCountWidget)
Displays the result count of an advanced filter:
- Compact card display
- Automatic refresh on data changes
- Link to the full filter result
Filter Statistic Widget (FilterStatisticWidget)
Shows a filter's result count at its reference dates as a line or bar chart. It needs a filter with "Save as statistic".
- Reference date: which of the filter's kinds of reference date is shown, such as "Month, end" or "Week, start"
- Range: the last n reference dates (default per period, e.g. 12 months or 31 days) or a calendar year
- A reference date without a value stays a gap, not a 0
- Values counted late, recomputed or taken over from V1 are drawn as a diamond; what they are is shown in the tooltip and the table view
Pending Releases (PendingReleasesWidget)
The Pending releases tile in the Calibration catalogue group lists every
calibration certificate awaiting a decision — across all calibrations, within
your own visibility scope. It only appears in the catalogue with the "Approve
calibration certificate" permission (release_request_decide).
Without it, a pending certificate is only visible on its calibration; you would have to know what to look for.
Per row: certificate number (linked to the calibration), device, customer, calibration date, requester and how long the request has been waiting. Sorted by the oldest request — a queue is worked from the front.
Bulk release. The checkboxes on the left plus Release selected release several certificates in one go (V1 parity: "release selected" in the calibration grid). The dialog takes one shared reason, which then appears in the log of every single certificate.
Every certificate is decided individually
The bulk release is not all-or-nothing. What passes, passes; what does not stays put and is named below the table, with its reason. Revoking an already granted release because the next one failed would be the worse answer. Each certificate gets its own log event.
Two row markers explain why a checkbox is missing or something else is:
| Marker | Meaning |
|---|---|
| Your own request | Under the four-eyes principle, whoever submitted may not approve. The row stays visible, but without a checkbox. |
| Declaration required | A seal rule with an accreditation seal applies to this certificate. The release dialog then asks for the declaration on the accreditation scope before the button unlocks. |
The gear holds title, row count and the scope: "Only what I may decide" hides your own requests and turns the overview into a pure worklist. In a public dashboard share the tile shows no data.
The process behind it: Releasing the calibration certificate.
MET/TEAM Widgets (Interfaces)
Two tiles in the Interfaces catalogue group, visible only with the permission for the MET/TEAM administration:
- MET/TEAM overview — state of the export queue (pending, processing, failed, done) including the warning when the counterpart is unreachable; failed entries can be requeued right from the tile
- MET/TEAM sync log — the most recent log entries with time, direction, device and error message
Both come at full width, the flat overview above the tall log — together they form a control dashboard for the interface. The gear sets instance, direction (log) and row count; in a public dashboard share they show no data.
Details: MET/TEAM interface
Configuring a Widget
Each widget can be configured via the gear icon:
- Title — Displayed name of the widget
- Filter — Which saved filter serves as the data source
- Display — Widget-specific options (color, chart type, columns)
- Refresh Interval — How often the data is reloaded
Live Updates
With Pusher set up (see Configuration), affected widgets update automatically when data changes. This is off by default; widgets then show the state at the time the page was loaded.
Managing Dashboards
- Create a new dashboard via the plus icon
- Switch dashboards via the dashboard selector
- Delete a dashboard via the context menu
- Reset layout restores the default arrangement
Templates
The Templates button in the header opens the dashboard templates: ready-made widget sets that are either system-wide, assigned to your role, or saved by yourself.
- Apply replaces the widgets of the current dashboard with the template's; the dashboard keeps its name.
- Apply as new dashboard adds it next to the current one, overwriting nothing.
- Reset at the top returns to your role's starting template — the state you began with.
- With the "Save own dashboard as template" permission
(
dashboard_template_saveas), the current dashboard can be saved as your own template.
A user with no dashboard at all receives their role's starting template on the first visit. Setup and role assignment: Dashboard Templates.